
The new release focuses on exploring actions that happened during page visits. It makes it possible to see the collected data in new ways to gain more insights.
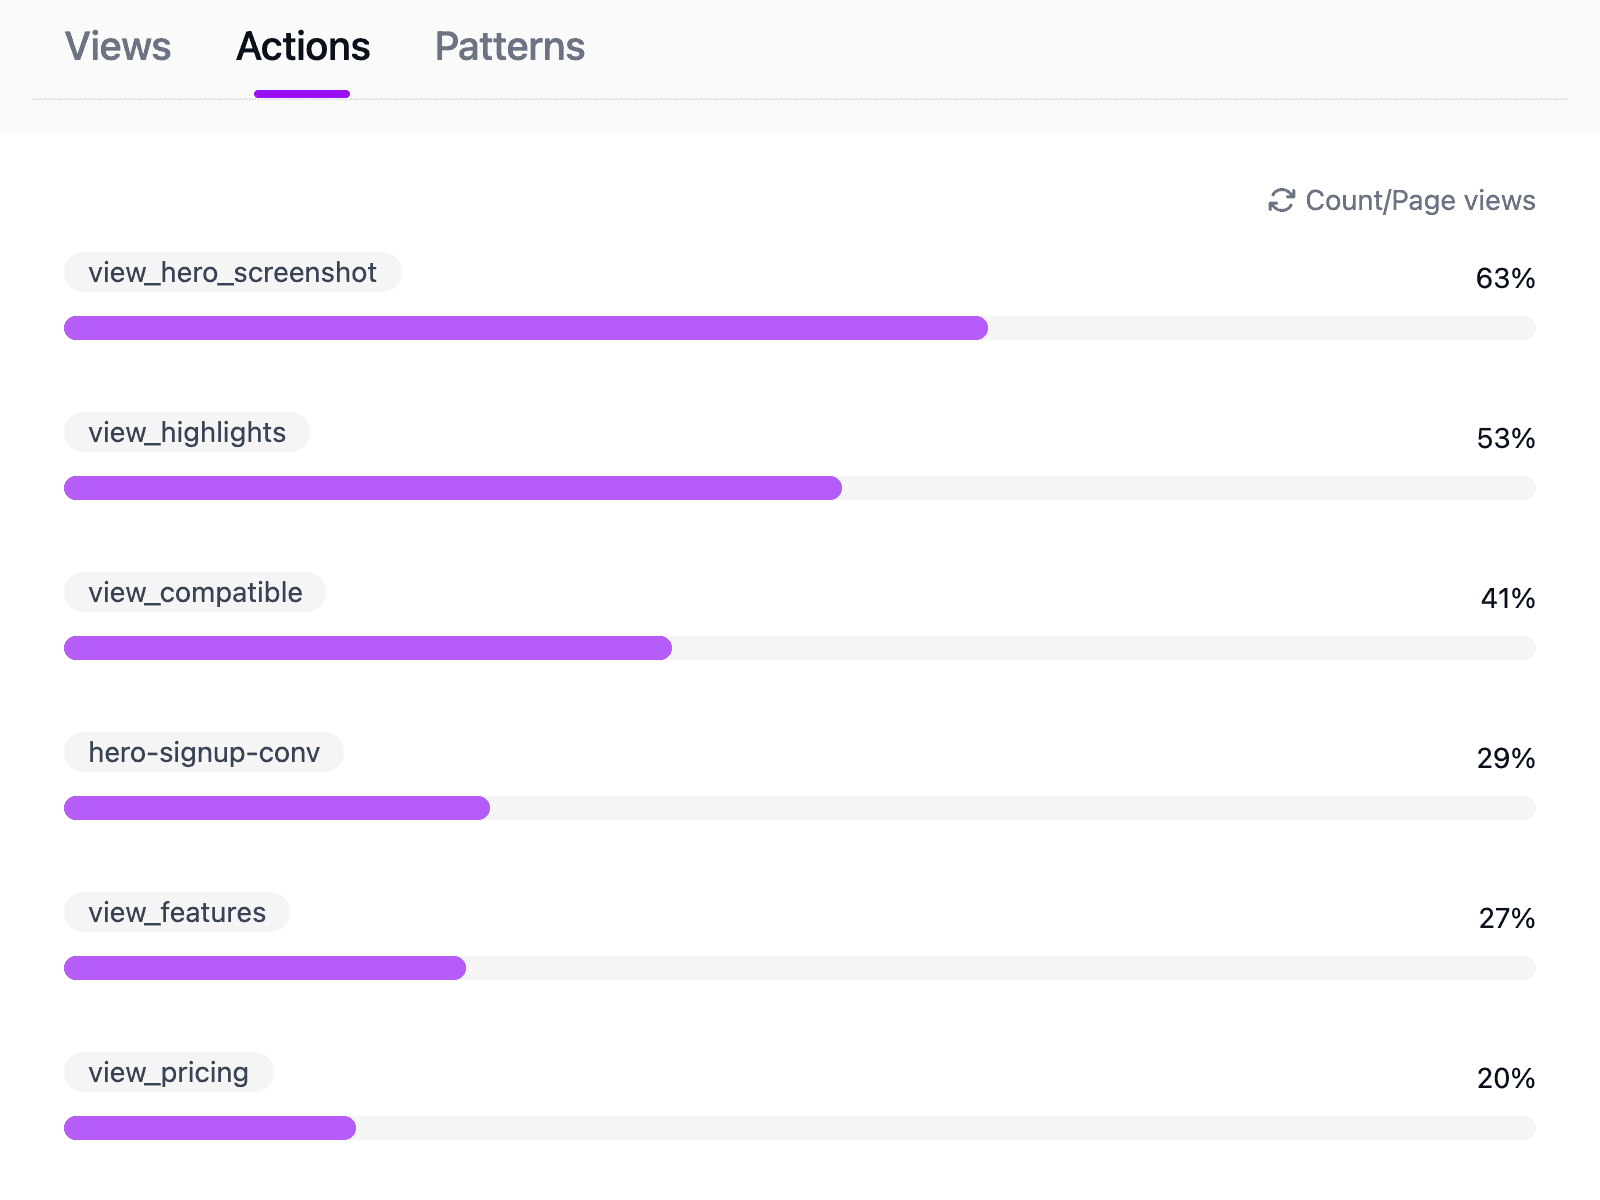
The first new thing is the actions panel, which shows how many times page actions (events) were reported. You can see the total count during the selected date range or the share within total page views.
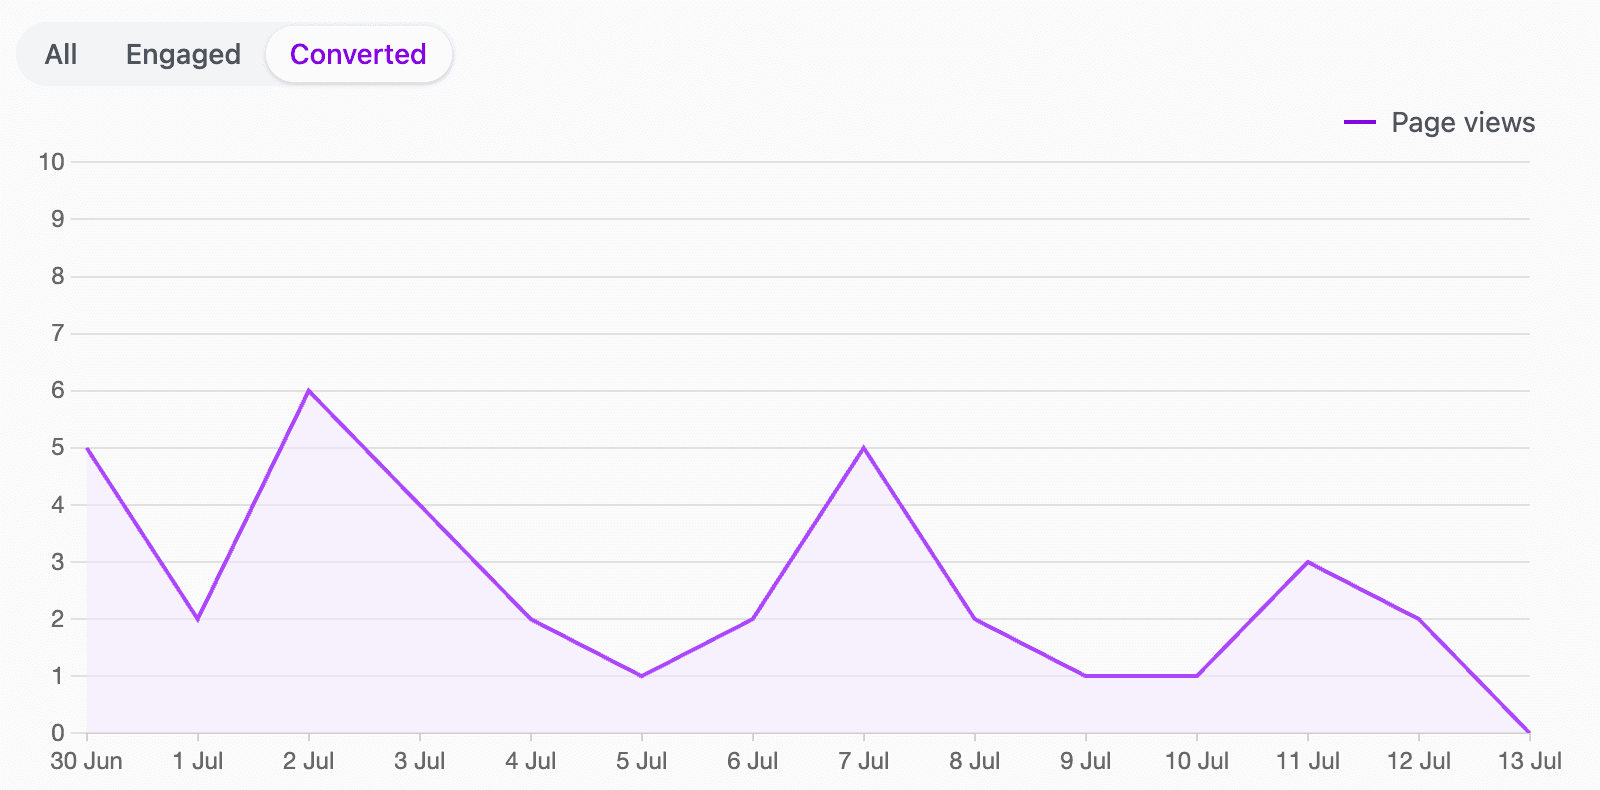
Another new element of the dashboard is the page views filter, located under the summary. It allows limiting presented page views to only engaged or converted ones. This affects all presented data, so, for example, you can see only converted views on the chart or analyze action patterns for only engaged visits.
There are also small UI fixes. Now aggregation filter cards expand to the total width available on wide screens. There is also a new mode switcher on the installation instruction modal.
Kamil